Bollinger Bands Bollinger Bands Indicator is almost the same as MA. The only different here is how bands (support line) and resistance line is draw on the chart. Bands line will be over or under market. To created Bollinger Bands it requires 2 types of input / data, namely the average and standard deviation .Like MA, it need only 1 average day with upperband (overbought) and when it is almost at lowerband it can be said as "oversold."
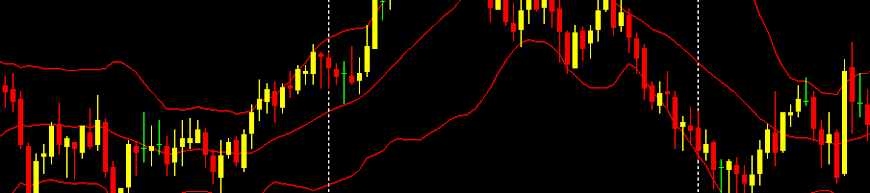
The smaller distance between upperband and lowerband always gives an early signs to trader that the market may be strong with a breakout to one direction.
Bollinger Bands are used to measure the level of volatility (the stability of the price movement). When prices tend to be idle the bands will be close to each others while when the prices moving upward the bands will be more widen as you can see in the below chart. Bollinger Bands also functions as a Support & Resistance where prices tend to move back and forth between the upper limit and lower limit (Bollinger Bounce).
Bolinger Bands can be very helpful if the price is in sideway movement (consolidation), that will produced breakout signal.
 Some indicators are often equipped with a central axis that Bollinger Bands can also be used as an indication of trend.


0 comments:
Post a Comment