Forex Guide: Basics of forex Market financial trading explained for forex newbies..

Showing posts with label Forex indicator. Show all posts

Friday, May 29, 2009

MACD indicator

MACD

MACD stands for Moving Averages Convergence divergence. It’s used to identify the Moving Averages with a new trend. MACD is also one of the most popular indicators used by trader.

By using MACD we can see 3 indicators altogether on the chart. First is the short period MA (fast), second is the long period MA (slow) and the last one is the order of the histogram or a line that describes the size of the distance between two MA's as shown in the chart.

MACD Crossover

Because both Moving Average line has a different speed, the fast MA will react more quickly to price changes compare to slow MA. When a new trend occurs, fast MA will intersect with slow MA at one point and the crossover between these lines indicated that a new trend began to occur.

The second signal occurs when MA on MACD penetrated through the MACD centerline.
The Weakness of MACD is in providing its signal. This signal is quite slow because many of MACD signal occur from the pervious average price.
The advantage of MACD is it’s rarely giving a false signal because of its smooth movement on the chart. Bare in mind that MACD signal does not indicate any overbought or oversold condition.


There are some basic MACD principles that you must know:

1. MACD will move to the highest peak until reach one critical point and vice versa.

2. There are 3 possible price movements of MACD:

• The price will move according to MACD
• Price moves opposite to MACD until one certain point and then follow the flow of MACD sign and we called this as Divergent Convergent
• Price will move sideway until the end of the MACD trend.

By using these principles we can maximize our profit with a very small loss.

Beside just using MACD indicator, Stochastic Slow 8,3,3 can be used to support the signal by determine the peak & valley of MACD/overbought-oversold area as shown below.

MACD usually determined by knowing the differences between 12-EMA and 26-EMA. When MACD has a positive value with a shortterm MA line above longterm MA line, this indicates that the price movement is towards to the top and vice versa for the negative MACD value. Most traders also concern about "0/neutral line", this method is quite similar to MA crossover discussed before where the cross over provide the buy signal while cross down give sell signal. Hope you may understand this terminology. If you still confuse you may refer back to our previous discussion about MA crossover here.

Example above shows the very basic fundamental of MACD. The cross method use here is similar to the cross method use in MA.

You must know that MACD is one of a lagging indicator; hence it should always follow market movements. As shown in the example above, we can see that MACD has a divergence characteristic. Divergence occur when MACD not following the movement of the market price.

-Best of luck-

Wednesday, May 27, 2009

Bollinger Bands

Bollinger Bands

Bollinger Bands Indicator is almost the same as MA. The only different here is how bands (support line) and resistance line is draw on the chart. Bands line will be over or under market. To created Bollinger Bands it requires 2 types of input / data, namely the average and standard deviation .Like MA, it need only 1 average day with upperband (overbought) and when it is almost at lowerband it can be said as "oversold."

The smaller distance between upperband and lowerband always gives an early signs to trader that the market may be strong with a breakout to one direction.

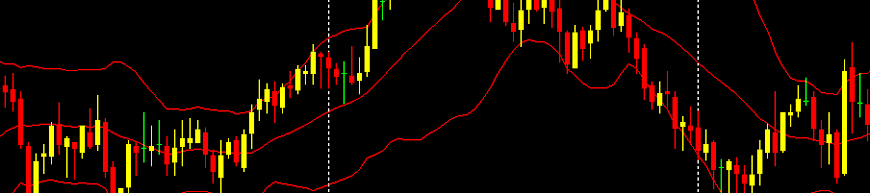
Bollinger Bands are used to measure the level of volatility (the stability of the price movement). When prices tend to be idle the bands will be close to each others while when the prices moving upward the bands will be more widen as you can see in the below chart.

Bollinger Bands also functions as a Support & Resistance where prices tend to move back and forth between the upper limit and lower limit (Bollinger Bounce).
Bolinger Bands can be very helpful if the price is in sideway movement (consolidation), that will produced breakout signal.

Bollinger Squeezze can be used as a sign of the new trend, which is when the bands move closer it usually indicates a significant movement will occurs. When the price penetrate the limit bands it will then move continuously as shown in the chart.

Some indicators are often equipped with a central axis that Bollinger Bands can also be used as an indication of trend.

Friday, May 22, 2009

Forex indicator: Moving Average (MA)

Moving Average(MA) is one of the most popular indicators. There are several types of moving average such as Simple Moving Average (SMA or MA only), Exponential Moving Average (EMA), and weighted Moving Average (WM A). MA is basically an average closing market price for one time frame that has been set. MA is just like a ruler which will move up or down according to the market direction.

It is an average closing price movement in a period of time. With MA, we can see the trend of the price. If it's moving to the top it simply means that the trends are growing up and vice versa. When prices penetrate MA mean trend is changing.


Below is an example of 100MA and 50MA. All calculation will be made by a computer program. One of the main functions of MA is to recognize the trend. MA is a kind of indicator of "lagging”. It moves according to the price and not a proactive motion prediction which means it does not predict anything but only clarify the trend whether uptrend or downtrend.


"Momentum" or the strength of trend can be changed by using smaller MA. The smaller average values of MA the stronger its momentum. MA that is less than 20 days may be classified into short-term, 20-100 to be medium-term and above 100 to be long term trend.

Traders often use more than 1 MA to see the movement of market as a whole, in terms of short, mid and long term MA may also be used for the "level" that can be considered as a support and resistance.

Note the example below. MA (200 days) acts as a powerful support line. Price will rise again when approaching this line. This opportunity should be taken by entry the LONG / BUY position.


In other ways, MA also can act as a barrier (resistance) if the price falls below MA line. Another function of MA is to set our SL value. The characteristic of MA that can be support or resistance can be the "tool" that we can use to minimize our risk during our trade. Note the example below:


In this example, we assume MA200 as support and has a long open position. By knowing that, we can set our SL under this support line.

One of the disadvantages of MA is that it cannot be used when the market is in correction phase or the "Consolidation”. Examples below indicate the disadvantages of MA when the market is not in trend; uptrend or downtrend.


Be careful with the "lag" of MA. Because all of the MA indicators are lagging, the signal provided by the MA is often slow even though the market has made its movement. This phenomenon often occurs when using MA.

Crossover is one of the principle when using MA;when the market moves from the top to the down of MA, or vise versa.


Another method of “crossover" is using more than 1 MA. This type of "Crossover" is valid when "shortterm" MA across above "longterm" MA.

This method is use to identify the "momentum" or the strength of the market movement. Long signal generated when the shortterm MA cross above long term MA while short signal generated when shortterm MA cross below longterm MA.

Example below shows the signal to entry position LONG result of crossover


"Triple crossover" is a way of using 3 types of MA all together. For example MA5, MA10 and MA20 cross between one another. By adding more MA, the false signals may be reduced.

Example of buy signal:


When MA5 cross with the MA10 and ascended to the top, this shows the buy signal was created. However, traders may wait until MA10 and MA20 cross once again and rise to the top. The crossing between MA10 with MA20 can be used to confirm the buy signal generated by initial signal of the MA5 and MA10.
