Technical Analysis is one way to analyze the market price and to predict the trend by comparing the on going pattern trend with the passed pattern trend.
According to technical analysis, market seemingly has a retention or "memory" and often followed the trend of casual. For example, if the price once reaches a certain stage, at one point and then the price fall, most likely it will occur again in the future at the same point. We recognize this point as resistance.
Two major components in the technical analysis are the chart and indicator (instructions). This indicator acts with a painting style based on the above chart analyses that have been programmed. There are two types of indicators which is leading indicator (precede) and lagging indicators (trail / slow):
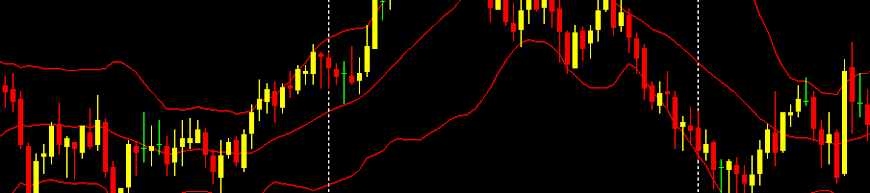
• Lagging Indicators consist of MA (Moving Average) and one of the most popular indicators. It is use to describe the trend if the price passed one curve MA. The popular settings of MA is like; 5EMA, 20EMA, 100EMA, 200SMA, 60SMA, 50EMA and many more.


0 comments:
Post a Comment